Monitoring Well Data Compilation and Evaluation
CAC-Water Study/Action Team is currently compiling water level data from multiple sources to help the community understand the status of our vital groundwater resource. Existing data are available from many sources for this effort and include:
- Well completion reports in the state Division of Water Resource permit files
- Environmental site monitoring well files with various agencies (US Environmental Protections Agency, [EPA], Colorado Department of Labor Oil and Public Safety [OPS])
- US Geological Survey (USGS) monitoring network from the 2003 Turkey Creek Watershed Study
- Monitoring wells included in existing augmentation plans or proposed developments with Jefferson County Planning and Zoning (PZ)
Water level data from these sources are very useful for tracking changes in groundwater conditions in our area. Water level measurement numbers represent the depth to water in each well from the ground surface. The study of water level data is used to assess many factors about groundwater conditions such as flow patterns and water balances. An important condition that water level data can be used to evaluate are changes in water in storage, which equates to understanding water availability through changing weather patterns and increasing development pressures.
When the depth to water increases over time it means that the water level at a well is dropping-or getting deeper. Essentially, this indicates that water in storage in the aquifer at that area is decreasing. When the depth to water decreases over time at a well it means the water level is rising-or coming up closer to the surface. This indicates an increase in water in storage. It is important that these depth to water measurements are made when a well is not being pumped. When a well has not been used for a period of time the depth to water is considered stabilized and is called a “static water level”. Several factors may cause static water levels in wells to rise or drop in our wells. Trends in water level changes can reflect changes in precipitation, groundwater recharge, evaporation and transpiration by vegetation-natural water going out, or depletion from well pumping- more water going out than we put back in for recharge of our treated wastewater.
Summary of the Conifer Well Monitor data from 2005 – 2024
Initially we have compiled data from ten wells in the central part of the Conifer-Aspen Park activity center. Many of these wells are wells used daily by individuals and several are dedicated monitoring wells that do not get pumped. Many of the wells lie within the activity center and other wells can be considered remote.
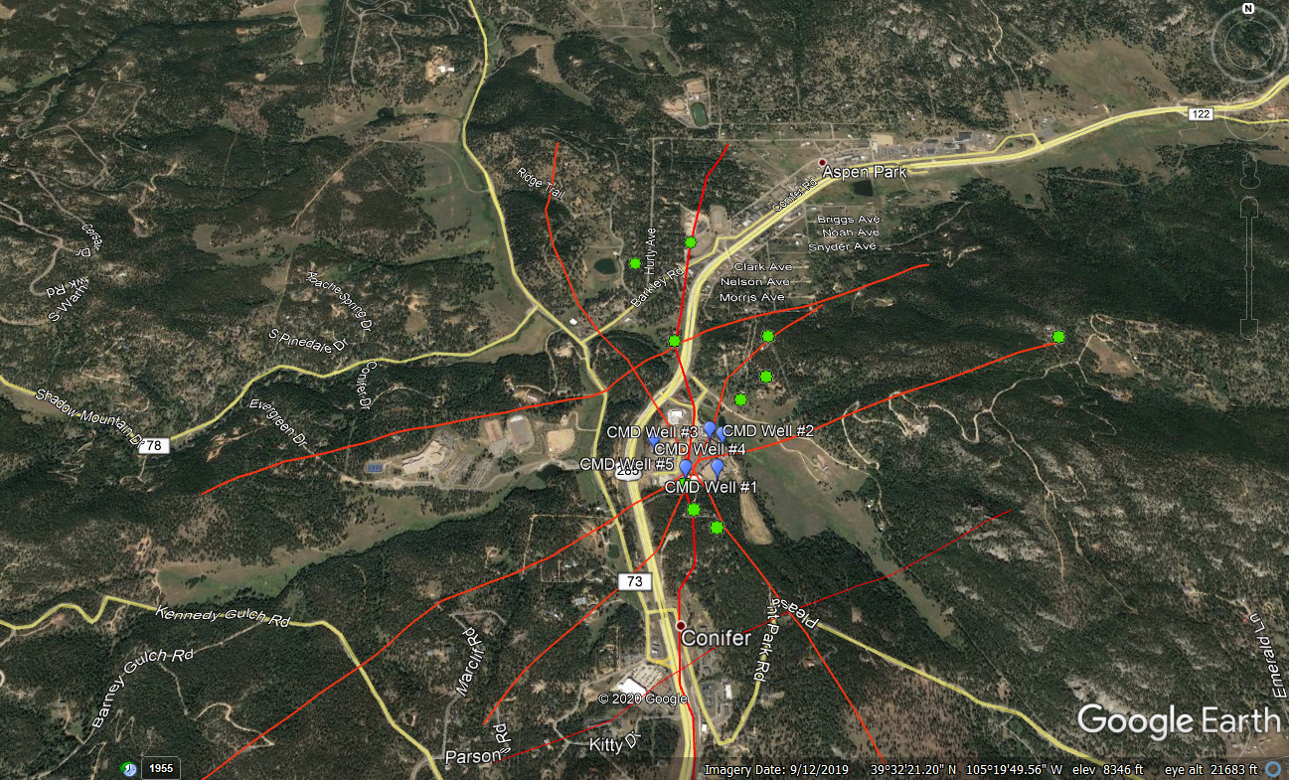

Water level data from 10 wells have been compiled from a period spanning 2005 to 2024. Many of the wells are in use and water levels can change dramatically during use cycles. These data have been processed to identify periods of stability between pump cycles that can be considered static water levels (SWL). The process steps yield data that ignore the pumping activity. There are some gaps for various reasons, but the time-series does provide an indication of the groundwater level in our well-based community. Summary charts have been created for each well. Five-year data series with trend lines (based on linear regression) provide some results that are general to the groundwater in Conifer.
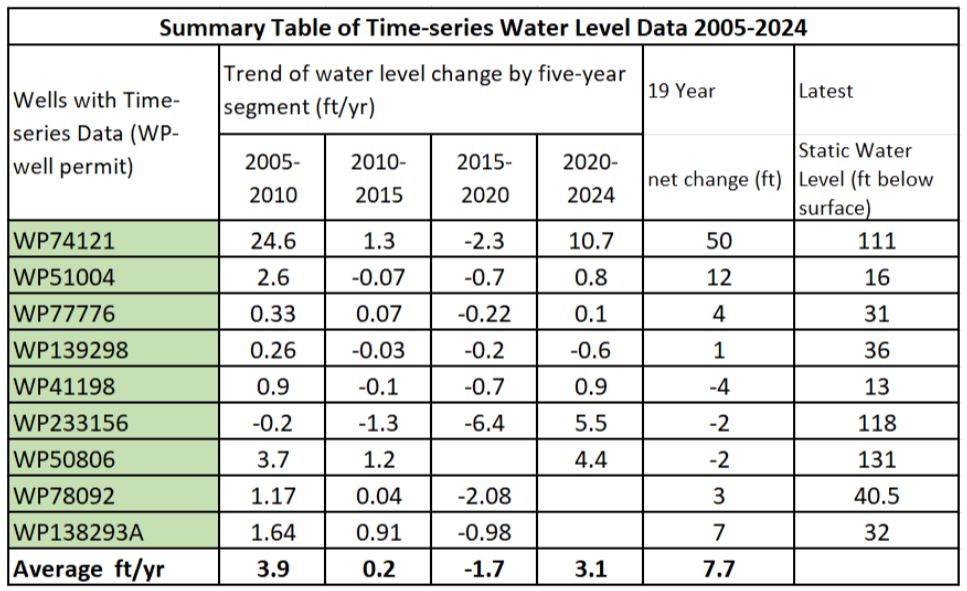
These data reveal several interesting trends in water level conditions in and near the activity center. Nine of the wells have trends with similar trends when broken into the five-year segments. One of the wells (WP 243773) is a monitoring well located near the Conifer Metropolitan District production wellfield that shows interference from nearby wells that seems to mask out the patterns seen in the other wells. About 4/7 of the wells have a higher static water level (SWL) in 2024 than they had in 2005. For 2005 – 2010, the SWL increased on average 3.9 feet/year. For 2010 – 2015, the SWL remained nearly constant, increasing only 0.2 feet/year. For 2015 – 2020, the SWL has been dropping at an average rate of 1.7 feet/year. For 2000-2024, the SWL has been increasing at an average 3.1 feet/year. Notice the annual snow melt peaks in the spring SWL and dry fall/winter cycles. As an example, the Jeffco Elementary School chart (WP51004) shows the typical rise, constant and decline trends clearly.
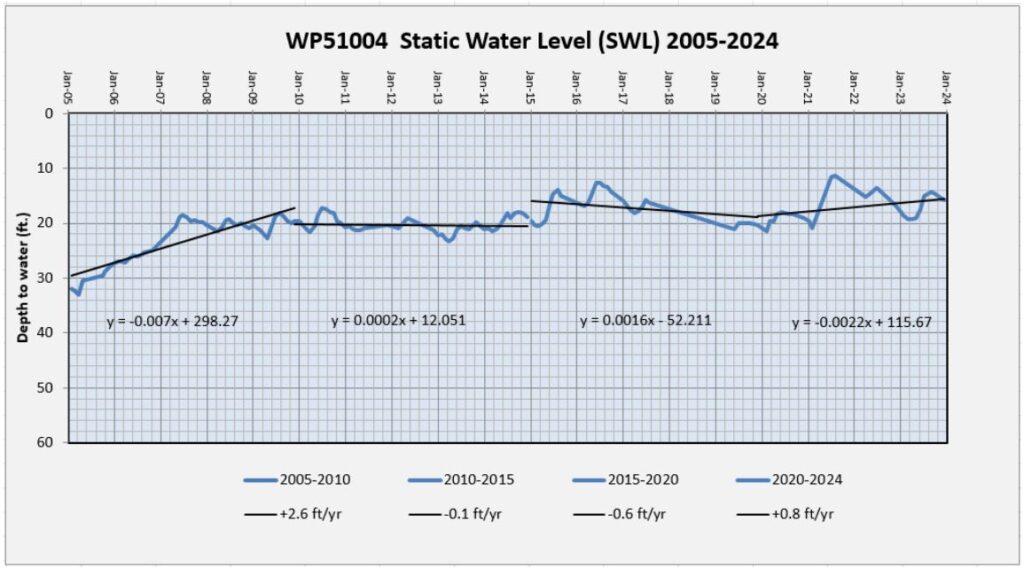
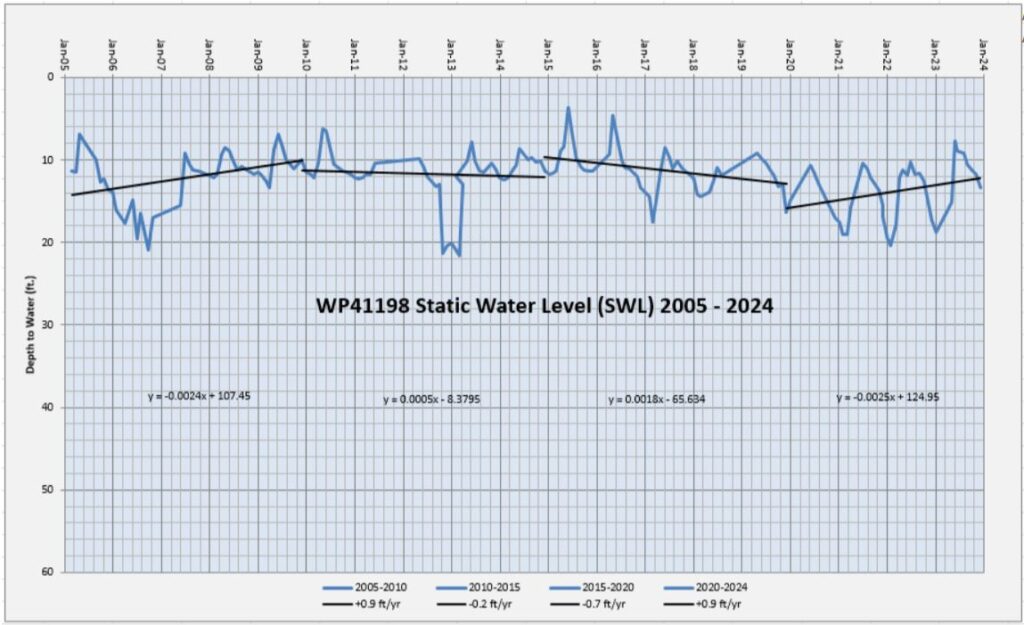
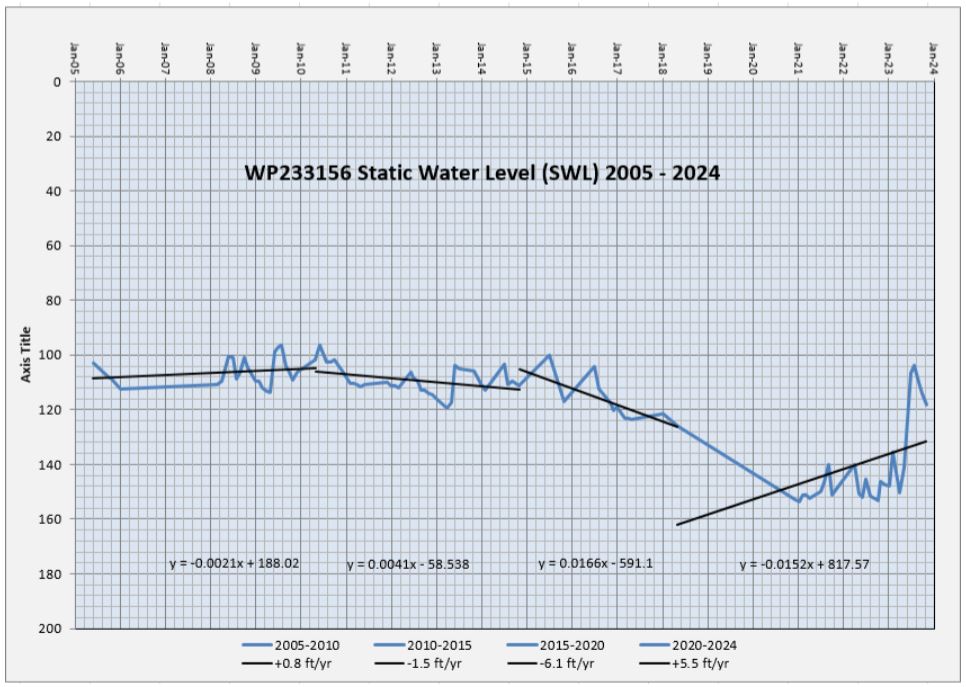
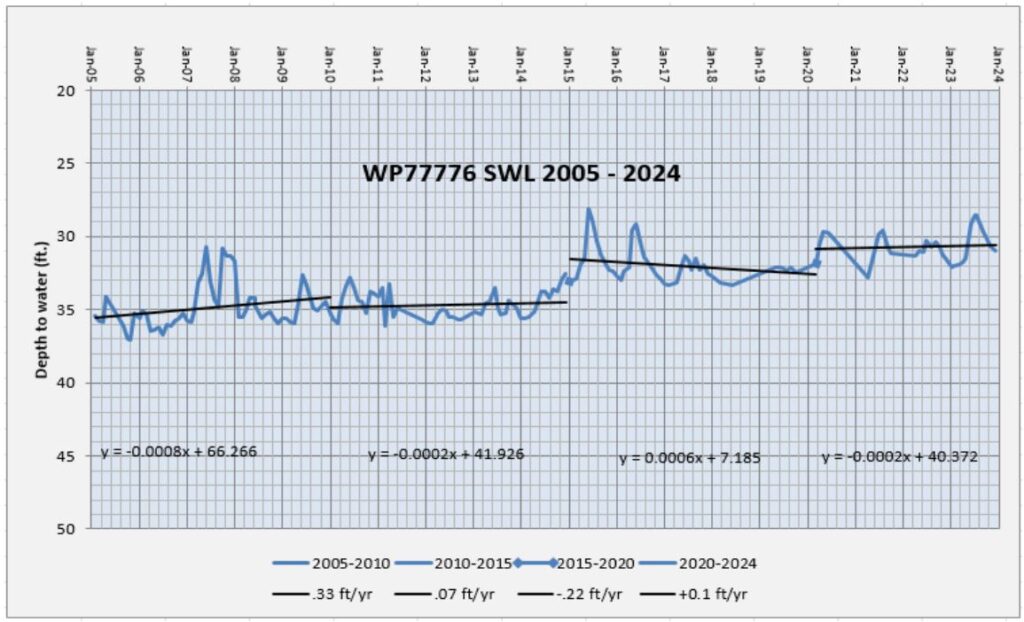
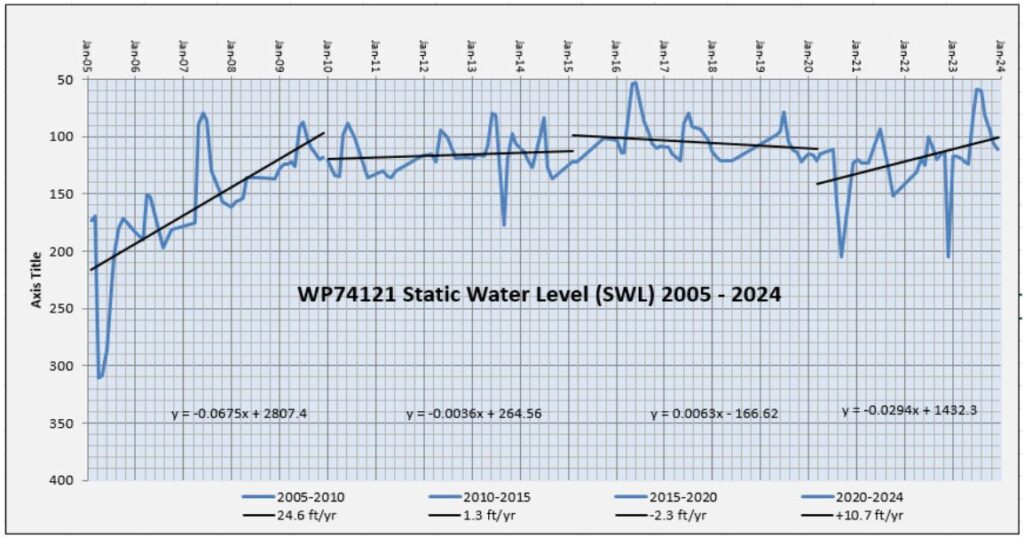
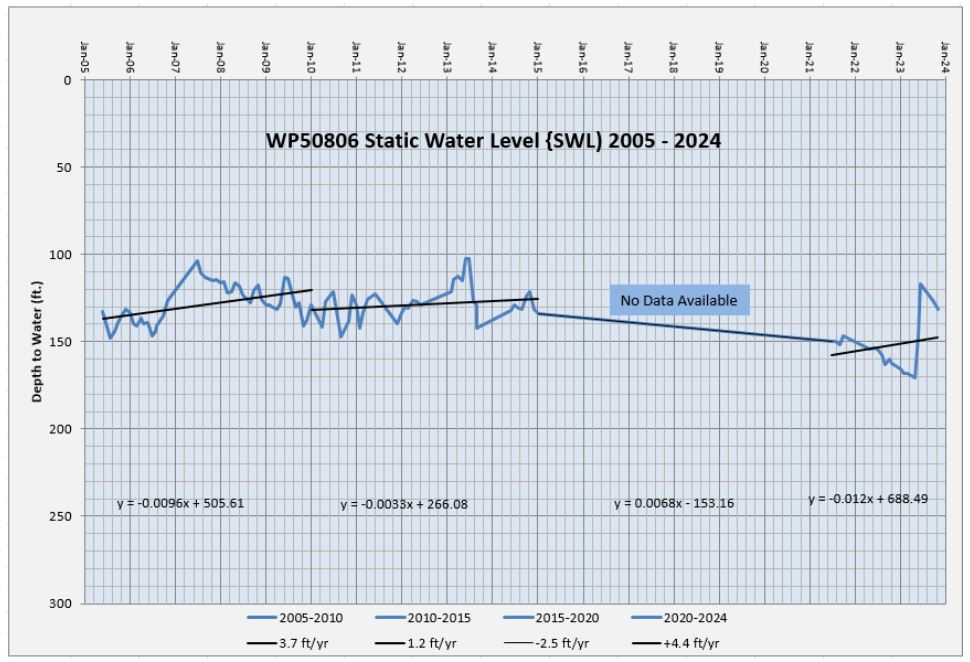
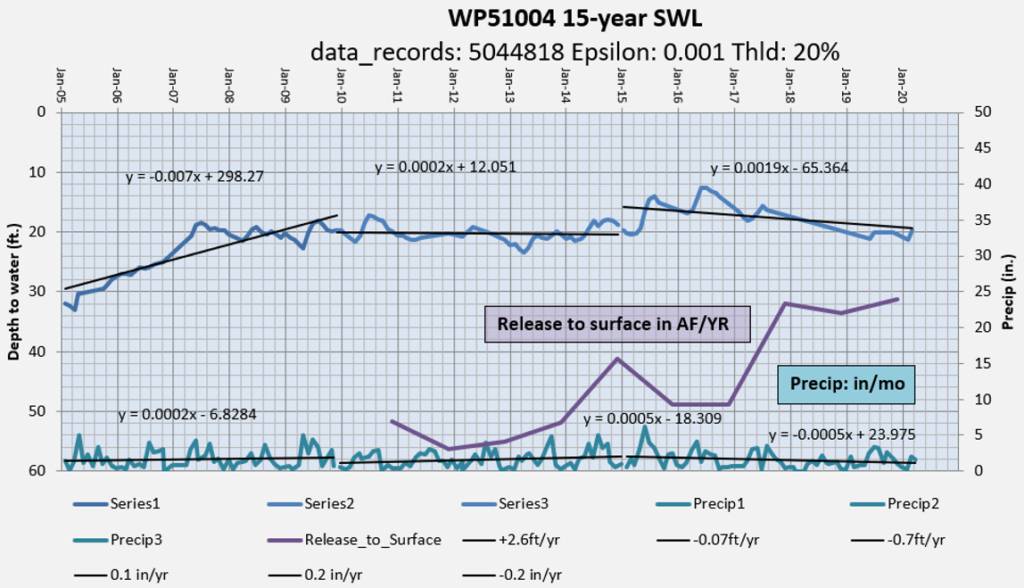
While land use, consumptive use and release of treated wastewater to surface all have some affect the groundwater budget, the overall trends appear to be following climate trends. The precipitation data presented on each chart is from a CoCoRaHS station in Conifer. (CoCoRaHS is an acronym for the Community Collaborative Rain, Hail and Snow Network). The closest precipitation data set that spans recent droughts from 2000-2020 is the Global Historical Climatology Network (GHCN) Station in Evergreen. The drought information is from the U.S. Drought Monitor. The overall precipitation and drought data are presented on the same chart. Since 2000, the longest duration of drought in Colorado lasted 395 weeks beginning on October 30, 2001 and ending on May 19, 2009. The most intense period of drought occurred the week of July 16, 2002 where D4 affected 34.37% of Colorado land. When we receive the precipitation, and the rate at which it occurs affect how much will recharge the groundwater aquifer.
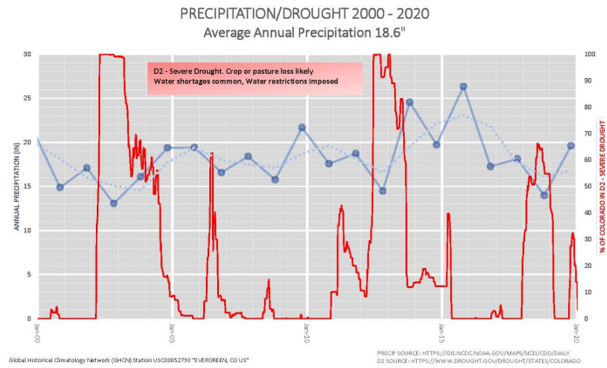
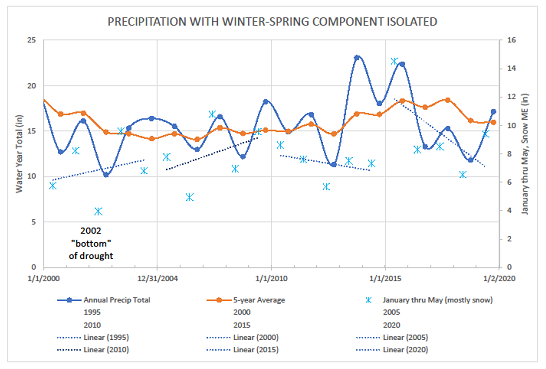
As the Precipitation Chart shows, the first five years of monitor data, from 2005 to 2010, occurs during the recovery from the most intense period of drought in 2002. The second five years, from 2010 to 2015, is centered symmetrically over a second period of drought. There are a couple years of high precipitation from 2014-2016. This starts the last five-year trends high and a third dry period in 2019 make the 2015 – 2020 trend negative. Another aspect is when, and in what form, the precipitation falls. Late winter and spring snowfall have been shown to provide the greatest recharge to the fractured crystalline bedrock aquifer. This next graph shows precipitation from January through May as blue asterisks with the assumption that most of this fell as snow. Trendlines for the same periods of time closely match those of water level changes.
Data and interpretations on this website are presented for general information only. This is a compilation of data from multiple sources and the compilers cannot ensure accuracy. Contents are continuously updated and the compilers strive to provide the best data possible but Conifer Area Council does not assume responsibility for use by others.
